
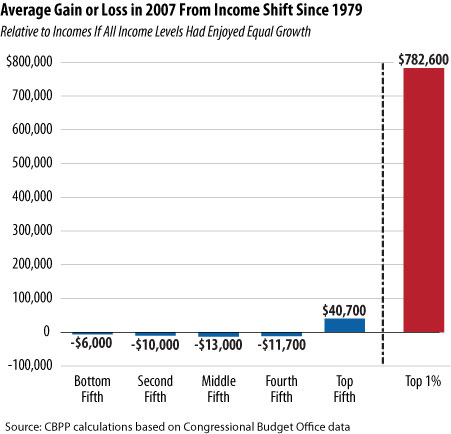

(via Economist’s View) Some very interesting data from the Congressional Budget Office and analysis by Chuck Marr the Center on Budget Policy and Priorities describing the shift in income since 1979. The bars represent the difference between what actually happened (the real income distribution in 2007) against what would have happened had the income distribution which held in 1979 been preserved:
For example, the average middle-income American family had $13,000 less after-tax income in 2007, and an average household in the top 1 percent had $782,600 more, than they would have had if incomes of all groups had grown at an equal rate since 1979.
Related Posts:
- The Great Income Shift (on Economist’s View)
- Enough is Enough on Tax Cuts for the Wealthy (original post on the Off the Charts Blog from the CBPP)
- The Great Income Shift (updated data from the Off the Charts Blog)